As 2023 comes to a close, it’s impossible to overlook the climatic record set in New York City. This year has officially become the warmest year in the city’s recorded history. Throughout the year, NYC experienced unusually warm weather, with average temperatures consistently staying above the historical norms. While NYC’s record-breaking year is significant, it is part of a larger global pattern with other areas around the world experiencing a similar record breaking year.
[table “” not found /]
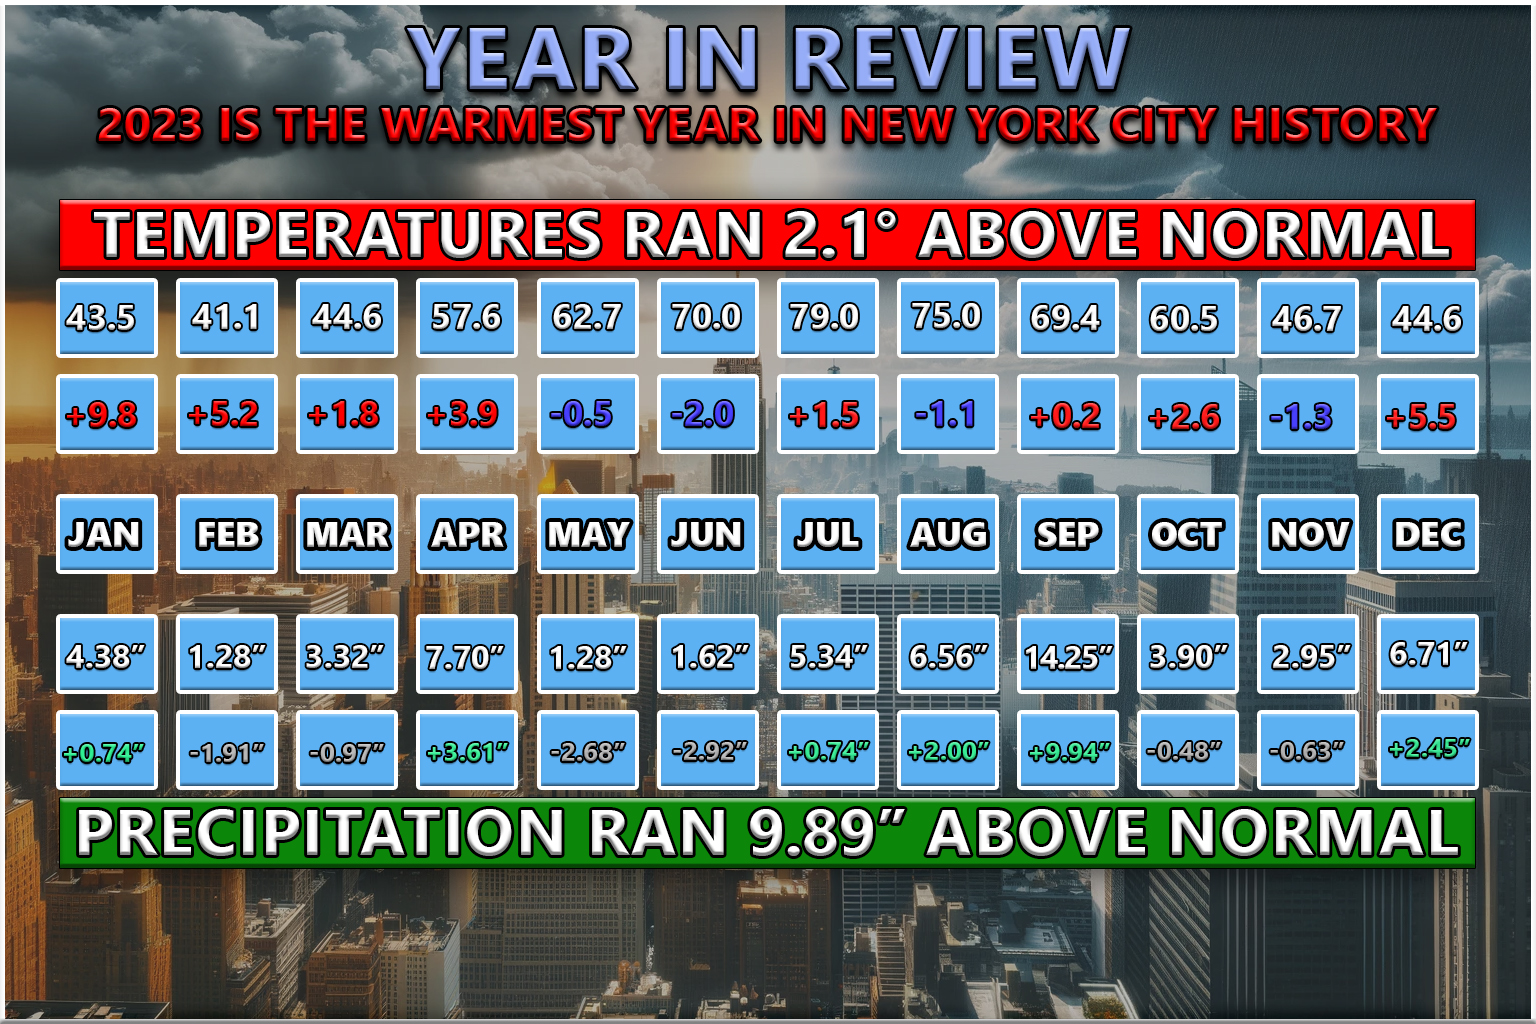
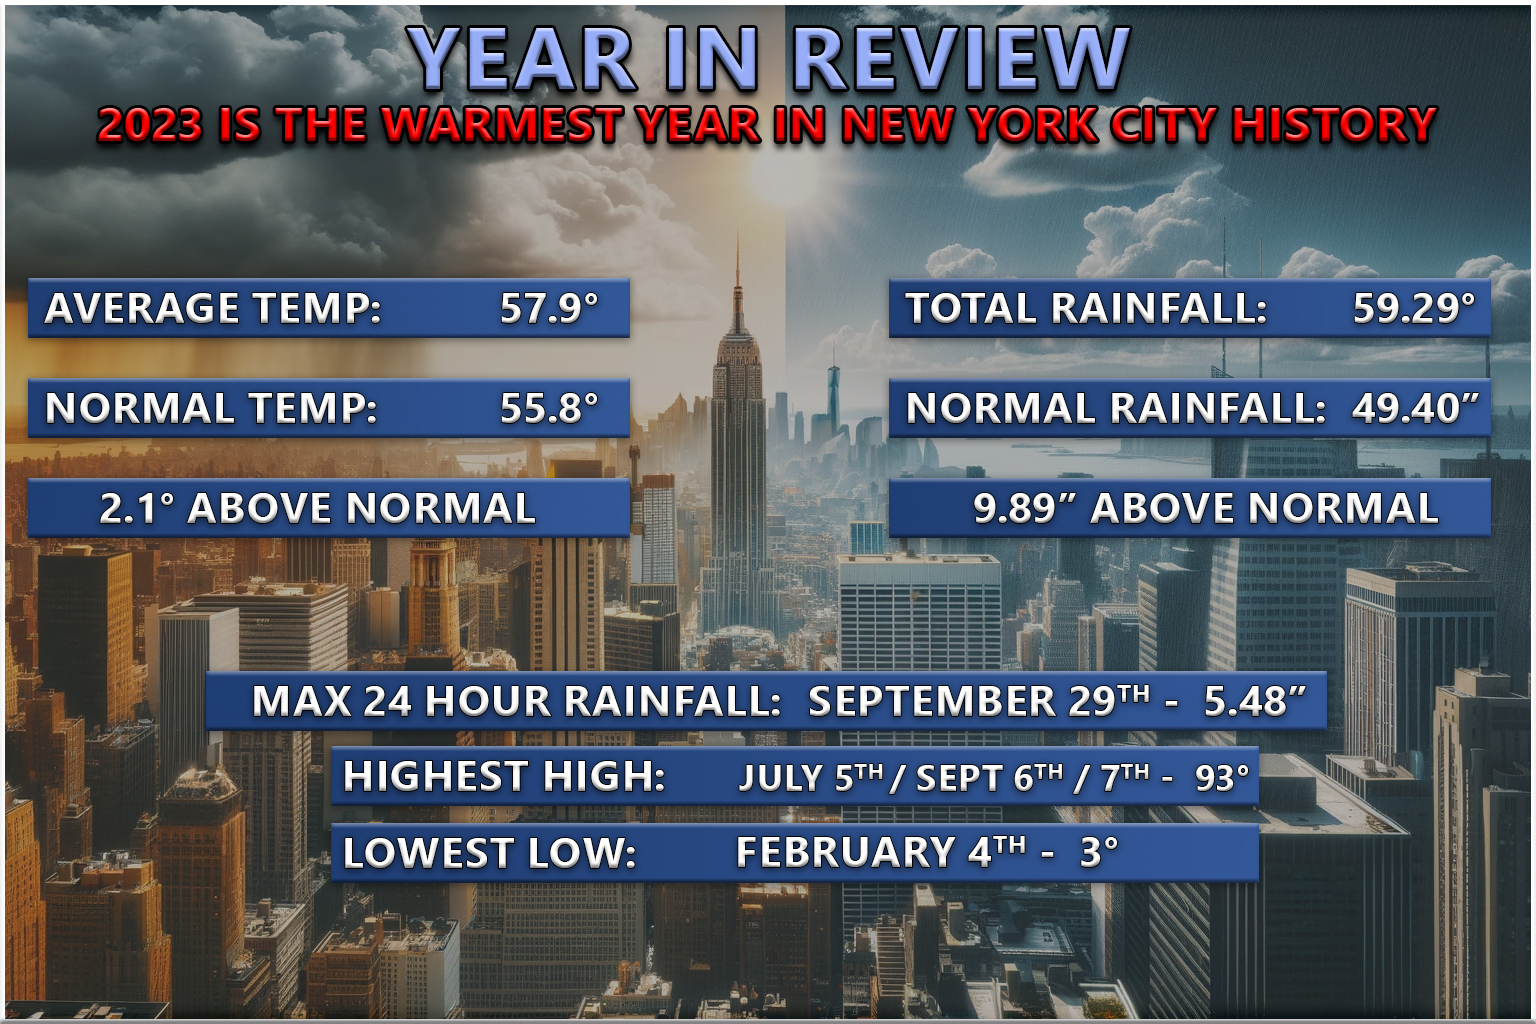
Below you will find temperature statistics for each month of the year.
Click the drop down menu and click 50 to view an entire months worth of data. If you’re on a mobile device, turn it into landscape mode to view the full table.
[table “” not found /]
January
[table “” not found /]
February
[table “” not found /]
March
[table “” not found /]
April
[table “” not found /]
May
[table “” not found /]
June
[table “” not found /]
July
[table “” not found /]
August
[table “” not found /]
September
[table “” not found /]
October
[table “” not found /]
November
[table “” not found /]
December
[table “” not found /]
[table “” not found /]